8 months ago
50
8 months ago
50
The image below shows that the World Sea Surface Temperature (60°South - 60°North) reached a new daily record high on August 13, 2023. As the image also shows, the sea surface temperature over the past few months has been much higher than in any other year on record.

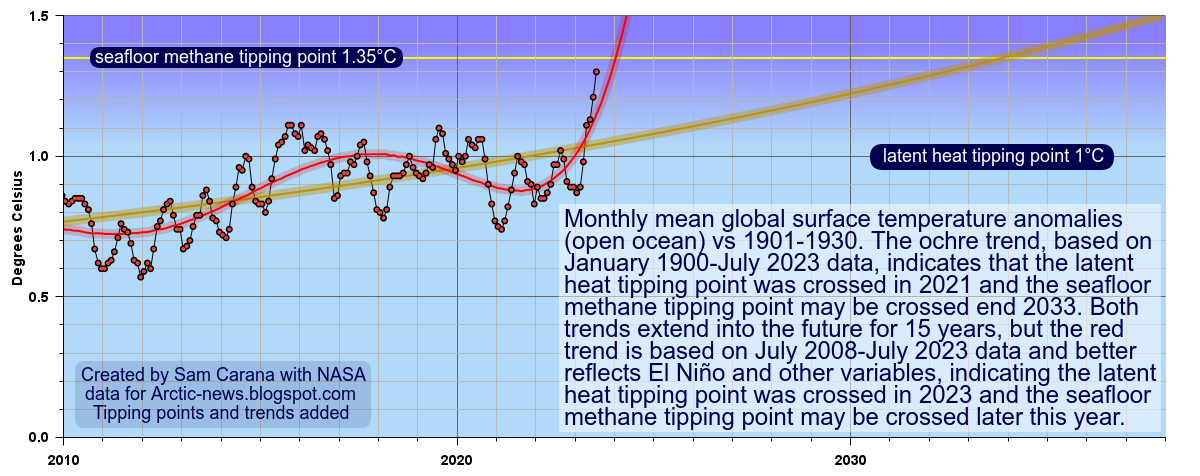
The image below shows NASA data for Monthly mean global surface temperature anomalies (open ocean) vs 1901-1930. The ochre trend, based on January 1900-July 2023 data, indicates that the latent heat tipping point was crossed in 2021 and the seafloor methane tipping point may be crossed by the end of 2033. Both trends extend into the future for 15 years, but the red trend is based on July 2008-July 2023 data and better reflects El Niño and other variables, and this red trend indicates that the latent heat tipping point was crossed in 2023 and the seafloor methane tipping point may be crossed later this year.
 |
| [ click on images to enlarge ] |
Sea ice constitutes a latent heat buffer, consuming incoming heat as it melts. Loss of this buffer is linked to subsequent destabilization of methane hydrates. So, there are two tipping points that are linked, and the latent heat tipping point gets crossed in the Arctic before the seafloor methane tipping point gets reached.
The latent heat tipping point is the point where Arctic sea ice loss is such that further incoming ocean heat that was previously consumed as Arctic sea ice melted, instead gets absorbed by the Arctic Ocean. This tipping point is estimated to correspond with an ocean temperature anomaly of 1°C above the long term average, 1901-1930 on the above image.The second tipping point occurs as more heat reaches the seafloor where it destabilizes hydrates contained in sediments at the seafloor. This tipping point comes with multiple self-reinforcing feedback loops such as explosive growth in methane volume setting off further destabilization. This tipping point will occur later, so it corresponds with a higher ocean temperature anomaly.
 |
| [ from earlier post ] |
The danger is that further heat will destabilize hydrates in these sediments, leading to explosive eruptions of methane, as its volume increases 160 to 180-fold when leaving the hydrates, and resulting in huge eruptions of methane both from the destabilizing hydrates and from methane that is present in the form of free gas underneath the hydrates.
 |
| [ from earlier post, click on images to enlarge ] |
The above image, from an earlier post, illustrates that warnings have been given before about the danger of these two tipping points getting crossed in the Arctic. In the above image, the trends are based on annual sea surface temperature data for the Northern Hemisphere. The seafloor methane tipping point is estimated to get crossed when the ocean temperature anomaly on the Northern Hemisphere goes beyond 1.35°C above its long term average.

 |
| [ Latent heat loss, feedback #14 on the Feedbacks page ] |
The situation is dire and is getting more dire every day, which calls for a Climate Emergency Declaration and implementation of comprehensive and effective action, as described in the Climate Plan with an update at Transforming Society.
• Climate Reanalyzer - daily sea surface temperature
https://climatereanalyzer.org/clim/sst_daily
• NASA - GISS Surface Temperature Analysis
• Sea surface temperature at record high
https://arctic-news.blogspot.com/2023/03/sea-surface-temperature-at-record-high.html
• Climate Plan
https://arctic-news.blogspot.com/p/climateplan.html
• Transforming Society
https://arctic-news.blogspot.com/2022/10/transforming-society.html
• Climate Emergency Declaration
https://arctic-news.blogspot.com/p/climate-emergency-declaration.html