5 months ago
42
5 months ago
42

The above image, created with Climate Reanalyzer data, shows the temperature anomaly (in °C) compared to the 1979-2000 mean. In blue are the years 1979-2022 and in black and white is the year 2023 through December 3, 2023. A trend is added in pink and white, based on 2023 data. Note that the 1979-2000 mean isn't pre-industrial, the anomaly from pre-industrial is significantly higher.

- The chance that the current El Niño will slow down over the next few months is minimal, as illustrated by the IRI image on the right.
- Earth's radiation imbalance is very high, as illustrated by the NASA image below.

- Antarctic sea ice extent is at record low for the time of year, as illustrated by the NSIDC image below, and the fall in extent is particularly steep in December. Sea ice loss results in less sunlight getting reflected back into space and instead getting absorbed by the ocean. The impact of Antarctic sea ice loss is even stronger than Arctic sea ice loss, as Antarctic sea ice is located closer to the Equator, as pointed out by Paul Beckwith in a video in an earlier post. A warmer Southern Ocean also comes with fewer bright clouds, further reducing albedo, as discussed here and here. For decades, there still were many lower clouds over the Southern Ocean, reflecting much sunlight back into space, but these lower clouds have been decreasing over time, further speeding up the amount of sunlight getting absorbed by the water of the Southern Ocean, and this 'pattern effect' could make a huge difference globally, as this study points out. Emissivity is a further factor; open oceans are less efficient than sea ice when it comes to emitting in the far-infrared region of the spectrum (feedback #23 on the feedbacks page).

- There is a huge danger that ocean heat will reach and destabilize methane hydrates that are contained in sediments at the seafloor of oceans, resulting in massive methane eruptions, as discussed in many earlier posts such as this one.
As more people become aware of the dire situation, widespread panic can set in, as warned about in this 2007 post. Instead of crossing a social tipping point that prompts people into action to combat the temperature rise, panic may set in that stops many people from showing up at work, resulting in a rapid loss of the aerosol masking effect, as industries that now co-emit cooling aerosols such as sulfates grind to a halt. People may start to collect and burn more wood, resulting in an increase in emissions that speed up the temperature rise. As temperatures rise, more fires could also break out in forests, peatlands and urban areas including landfills and waste dumps, further contributing to emissions that speed up the temperature rise.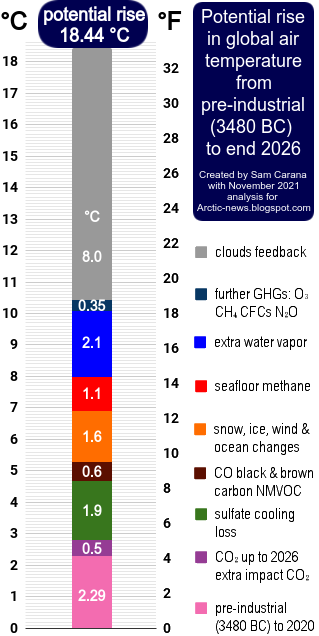
[ image from the Extinction page ]

As said, the 1979-2000 base used in the image at the top is not pre-industrial. Anomalies would be much higher when using a genuinely pre-industrial base. The image on the right uses a 2.29°C 2020 anomaly from 3480 BC.
The image on the right shows many elements that could jointly cause a rapid temperature rise of more than 10°C, in the process causing the clouds tipping point to get crossed that can push up the temperature rise by a further 8°C.
Much of this is described at the extinction page.
Conclusion
The precautionary principle calls for comprehensive and effective action to reduce the damage and to improve the situation as described in this 2022 post, in line with recognition of the climate emergency we're in.
Links
• Climate Reanalyzer
https://climatereanalyzer.org/clim/t2_daily/?dm_id=world
• Columbia Climate School, International Research Institute for Climate and Society
https://nsidc.org/arcticseaicenews/charctic-interactive-sea-ice-graph
• The Clouds Feedback and the Clouds Tipping Point
https://arctic-news.blogspot.com/p/clouds-feedback.html
• Extinction
https://arctic-news.blogspot.com/p/extinction.html
• Pre-industrial
https://arctic-news.blogspot.com/p/pre-industrial.html
• Transforming Society
https://arctic-news.blogspot.com/2022/10/transforming-society.html
• Climate Plan
https://arctic-news.blogspot.com/p/climateplan.html
• Climate Emergency Declaration
https://arctic-news.blogspot.com/p/climate-emergency-declaration.html